4 Components Approach to Managing Apparent Losses
How to Squeeze the Lost Revenue Box
Non-Revenue Water consists of Unbilled Authorised Consumption, Apparent Losses and Real Losses. Apparent Losses (also known as Commercial Losses) result in lost revenue for Utilities, as they consist of unauthorized consumption (theft or illegal use), and all types of inaccuracies associated with production metering and customer metering. Errors in the assessment of Apparent Losses may lead to errors in the estimation of Real Losses and erroneous approaches in planning for Non-Revenue Water Reduction.
In order to reduce both Apparent and Real Losses in a sustainable way, it is necessary to build appropriate action planning models to control Non-Revenue Water as a whole. NRW reduction involves the control of a large number of components. Free Guidance Notes on Apparent Losses and Water Loss Reduction Planning (77 pages) with 9 separate papers as Appendices, are available from September 2015 in a format designed to be updated when required.
Apparent Losses reduction requires many types of expertise, not only in technical and operational fields but also in human, social and management fields. Numerous free papers and presentations by international authors on International good practices in Apparent Losses assessment and management can also be found at Outreach (App Loss).
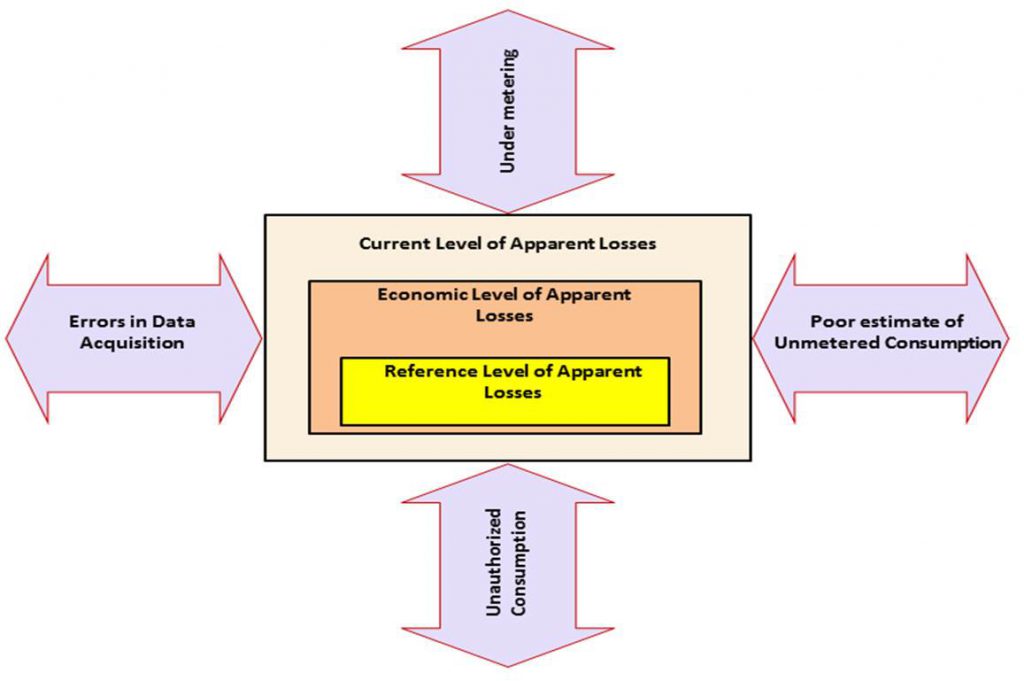
The diagram below was developed by the Apparent Losses Initiative, which was launched by the International Water Association in November 2007. It is now widely used internationally as a simple means of explaining the four basic categories of activity that need to be under control for effective operational management of Apparent Losses.

The area of the large rectangle represents the Current Annual Apparent Losses, in volume per year, for any specific system. The intermediate rectangle represents the Economic Level of Apparent Losses, which is a combination of the various economic levels for the four categories of action. Finally, the small rectangle represents a Reference Level of Apparent Losses, which is based on the performance of well-managed Utilities worldwide.
Each category of action is represented as a 2-way arrow. If the Utility implements the corrective action, the relevant loss will be reduced. If the Utility does not, the AL box will expand and Apparent Losses will increase. Each category of losses has a natural rate of rising.
If each of the four management components is applied at an economic level of activity (with priority being given to those with the quickest payback period or highest benefit/cost ratio), the Apparent Losses volume should eventually reduce to an economic level of Apparent Losses (shown as the small rectangle). This technique, which is also applied to the management of Real Losses, is known as ‘squeezing the box’.
The four main categories of actions to get Apparent Losses under control are listed below with a non-exhaustive list of activities that may be included under these categories.
Data Acquisition errors: data capture, data transmission, data processing, meter reading procedures, meter reading procedures, automatic meter reading (AMR), supervisory control and data acquisition (SCADA) etc.
Water Meter errors: installation and calibration procedures for large meters, calculation of the average weighted error (AWE) for customer meters, selection of customer meters, consumption profiles, meter sizing, meter installation, meter ageing, optimum replacement period, comprehensive and/or targeted replacement programs, etc.
Errors in Unmetered Consumption estimates: overall metering policy (this component may be important when a significant number of customers are not metered).
Unauthorized Consumption: detection of unregistered connections and detection of frauds on registered connections, overall customer census, targeted customer census, communication policy, improvement of customer management procedures, etc.
Operational approach and Action Planning
It is essential to get all four categories of Apparent Losses under control: if the Utility only puts the stress on a single category, the relevant Apparent Losses component may decrease, but the losses generated by the other categories that are not under control will continue to increase. Despite the implemented action, the total Apparent Losses may not change or may even continue to increase. In some specific cases, it appears that the levels of Real Losses and Apparent Losses are linked together. Thus, a combined approach is necessary to get both categories of loss under control (dynamics of loss)


 MCAST Main Campus
  +356 2398 7100
 information@mcast.edu.mt